


Key Takeaways
- Organic traffic has two dollar values: replacement value, what the same clicks would cost as ads, and return on content spend (ROCS), the revenue earned per dollar of content spend.
- Four inputs drive the calculation: cost per click (CPC) from your ad account, the conversion rate of organic visitors, average order value, and organic clicks segmented by channel.
- 1,000 monthly organic clicks at a $2.50 CPC hold $2,500 in replacement value, and at 3% conversion and a $200 order value, they return $6,000, a 4x ROCS on $1,500.
- Click value understates the true number because content keeps earning for years and podcast listens have no paid equivalent. Multichannel organic distribution has returned 5x to 50x on content spend.
- At AmpiFire, we raise click volume, the one input a business controls, by publishing answers to buyer questions in 8 formats across 300+ sites, including YouTube, Spotify, and Pinterest.
What Does Return on Content Spend (ROCS) Measure?
Return on content spend (ROCS) measures how much revenue organic traffic generates for every dollar spent creating and publishing content. Paired with replacement value, it turns a traffic report into a figure a finance team can compare against paid ads. Most reporting stops at sessions and rankings, though, so content often reaches budget meetings with no revenue attached.
The math is simple, but one wrong input skews the whole result. A site-wide conversion rate blends research-stage organic visitors with paid traffic landing straight on a product page, which inflates the figure. Counting Google search alone does the opposite, undercounting clicks for any brand that also publishes on YouTube, Spotify, or Pinterest.
Cost per click, conversion rate, and order value are largely set by the market and your pricing, so click volume is the input a business can actually move. AmpiFire works on that input by researching the questions buyers ask before purchase and publishing answers on the platforms where they search.

How AmpiFire Works:
- Research & Target: Find high-demand topics your buyers search for.
- Create & Repurpose: AmpiFire’s AmpCast AI generates news articles, blog posts, interview podcasts, longer informational videos, reels/shorts, infographics, flipbooks/slideshows, and social posts.
- Distribute & Amplify: Auto-publish to 300+ sites, including Google News, YouTube, Spotify, and major news networks.
Get more traffic from people who want to buy your stuff, and powerful “As Seen On” trust badges for your site.
Do It Yourself (with AI), Done For You Content, & 100% Managed Organic Growth options available.
Grow Your Free Traffic From Everywhere
How to Calculate the Dollar Value of Your Organic Traffic?

Four inputs produce both numbers. Three are pulled from tools already in use.
1. Find Your Typical Cost Per Click
Pull the average cost per click from your Google Ads or Meta account for the keywords and audiences closest to your organic topics. Use account data rather than an industry average, since costs vary by niche and geography. Agencies running the calculation for a client should use the client’s own account figure.
2. Know Your Conversion Rate & Average Order Value
Use the percentage of visitors who become customers and the average order value. Use the conversion rate for organic visitors specifically rather than the site-wide blend. Research-stage organic traffic converts differently from paid traffic landing directly on a product page, and high-ticket brands often see rates below 1% while still generating strong revenue at volume.
3. Track Your Organic Clicks
Isolate sessions arriving from organic sources in Google Analytics, segmented by channel so organic search, organic video, organic social, organic shopping, and referral visits are counted separately. Counting Google search alone understates the total for any brand publishing across multiple platforms.
4. Run the Two Calculations
Multiply clicks by cost per click (CPC) for replacement value. For ROCS, multiply clicks by conversion rate to get customers, multiply customers by average order value to get revenue, then divide that revenue by content spend for the period.
Worked Example: What 1,000 Organic Clicks Are Worth
A business receiving 1,000 organic clicks per month, paying $2.50 per click for equivalent paid traffic, holds $2,500 in monthly replacement value. Over twelve months, that is $30,000 of media it didn’t buy.
At a 3% conversion rate, those clicks produce 30 customers. At a $200 average order value, organic visitors account for $6,000 in monthly sales. Against a $1,500 monthly content investment, that is a ROCS of 4x.
| Input | Figure |
| Monthly organic clicks | 1,000 |
| Typical cost per click | $2.50 |
| Replacement value | $2,500 |
| Conversion rate | 3% |
| Customers per month | 30 |
| Average order value | $200 |
| Monthly sales from organic | $6,000 |
| Monthly content spend | $1,500 |
| ROCS | 4x |
Calculated across six months rather than one, the figures increase. Content published in month one still generates clicks in month six, while its production cost cleared the books at the start.
Why Click Value Alone Understates Your True Number
The replacement calculation misses three things.
- Published content keeps earning after the spend is booked. An article, video, or podcast episode published this quarter continues drawing visitors for years. The production cost is fixed while the click count rises, so the ratio improves every month the content stays live.
- Several organic channels carry no paid equivalent to price against. A listener who finished a podcast episode on Spotify, a viewer who watched a long-form video on YouTube, and a buyer who found the brand inside an AI answer produce no comparable cost-per-click figure. Those touchpoints fall outside the arithmetic.
- Organic presence raises the conversion rate of paid traffic. A prospect who sees an ad, searches the brand, and finds articles, videos, and podcast episodes answering their questions buys more often. That lift shows up in the ad account rather than the content report, even though the content produced it.
What Good ROCS Results Look Like
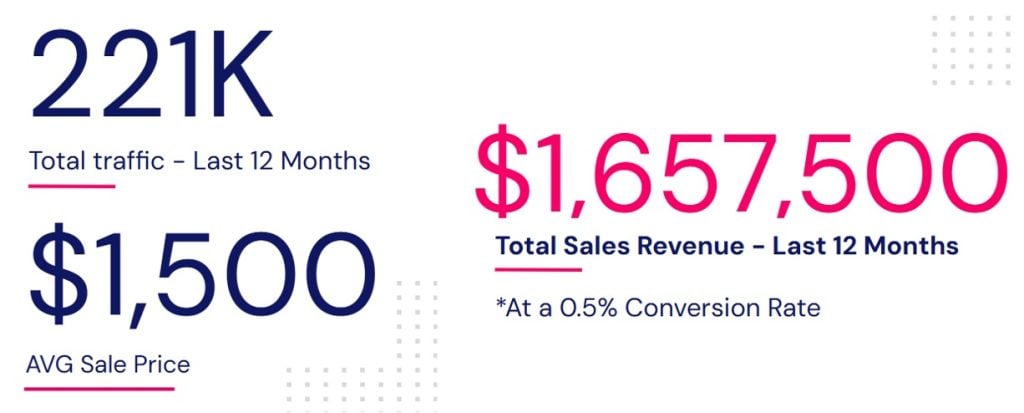
Targeted paid promotions typically return 1x to 3x their cost. Multichannel organic distribution has produced returns between 5x and 50x on content spend, and the upper end of that range appears in our own client reporting.
For one managed client, we matched Google Analytics organic data against the client’s average sales data and confirmed $1,657,500 in sales attributable to their blog.
Attribution at that level requires three things:
- Organic sessions segmented by channel
- A conversion rate specific to organic visitors
- An order value the business is confident in
Without all three, a ROCS figure is just an estimate. With them, it is a proven number.
Grow the Organic Clicks Behind Your ROCS with AmpiFire
A ROCS figure built on channel-segmented clicks, an organic-specific conversion rate, and a reliable order value turns content from a cost line into a proven return. With pricing and conversion rates largely set by your niche, click volume determines how large that return gets, and content keeps earning long after its cost is paid.
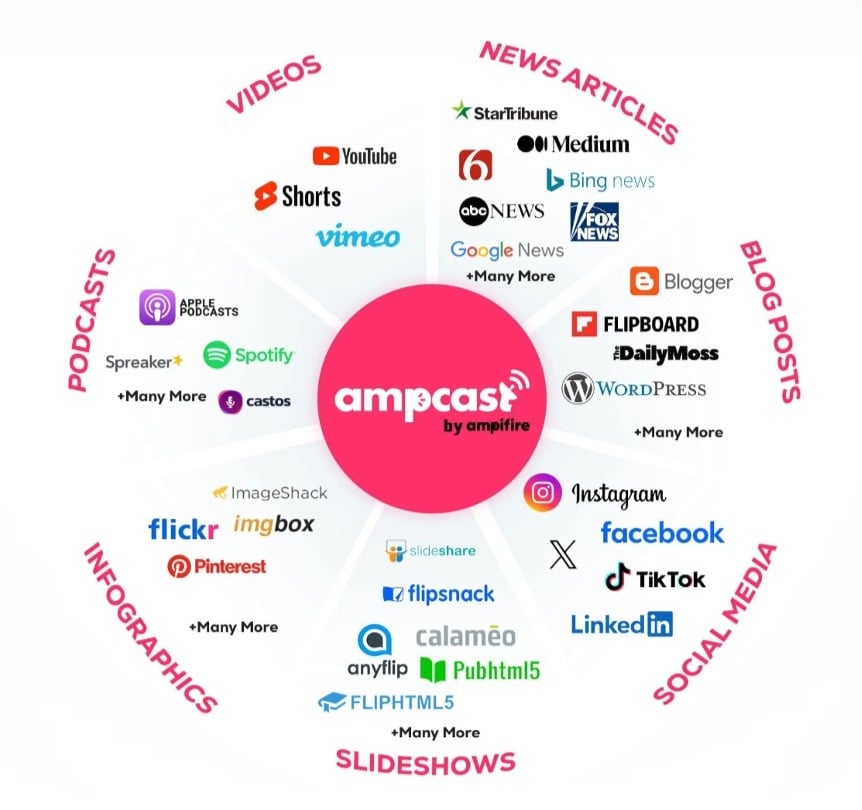
At AmpiFire, we research the questions your buyers ask and publish the answers as articles, videos, podcasts, and more across 300+ sites, including YouTube, Spotify, and Google News. Choose Do-It-Yourself, Done-For-You, or fully managed support, then book a call with our team to see what that publishing could add to your organic traffic value.
Frequently Asked Questions (FAQs)
What counts as content spend in the ROCS denominator?
Include everything paid to produce and publish the content: writer and editor fees, design and video production, agency or platform costs, and distribution charges. Salaried in-house staff is usually counted at a prorated share of salary. Exclude hosting and analytics tools, since those costs exist regardless of content output.
Should branded search clicks count toward the figure?
Excluding them gives a more conservative figure. Visitors searching your brand name already knew the business, so counting those clicks credits content with traffic it did not create. Filter branded queries out in Google Search Console and run the calculation on non-branded organic clicks for a defensible number.
Can I calculate ROCS if I sell leads rather than products?
Yes. Replace average order value with average closed-deal value, then multiply by your lead-to-customer close rate. A 5% close rate on a $4,000 average deal gives an effective value of $200 per lead. Substitute that figure for order value, and the rest of the calculation stays the same.
What cost per click should I use if I have never run ads?
Use Google Ads Keyword Planner to pull suggested bid ranges for the keywords your pages already rank for, and take the midpoint. The figure is less precise than account data but gives a defensible working number. Revisit it after running any paid campaign.
How does AmpiFire improve the ROCS number I calculate?
At AmpiFire, we raise the click count the calculation uses. It researches the questions buyers ask before purchase, turns each topic into 8 content formats (news articles, blog posts, interview podcasts, longer informational videos, reels/shorts, infographics, flipbooks/slideshows, and social posts), and publishes them across 300+ sites, including YouTube, Spotify, Pinterest, Google News, and FOX affiliate sites.
*Disclaimer: Results may vary based on individual circumstances, business type, and content strategy. The time savings and outcomes mentioned are based on typical user experiences and are not guaranteed. For specific pricing and service details, please visit AmpiFire.
Author
Related Posts

Ecommerce Organic Traffic Revenue Calulator
How to Use the E-commerce Traffic-to-Sales Calculator This calculator helps you estimate the potential increase in monthly sales revenue based…


Organic Traffic vs Direct Traffic: What’s the Difference?
Understand organic vs direct traffic differences and how each impacts your website growth. Learn strategies to build both traffic types.

61.5x Return On Content Spend: How A $5,000/mo Organic Traffic Strategy Competed With Fitness Giants Spending $100M+ On Ads
A fitness equipment brand from Ohio faced an impossible challenge. Their competitors, Peloton and NordicTrack, each spent over $100 million…


Organic vs Inorganic Traffic: What’s the Difference & Examples
Discover the key differences between organic and inorganic traffic, their ROI impact, and how multichannel content distribution builds sustainable business…

Home Robots eCom Shopify Store Boosted Organic Traffic by 195% with Hyper-Targeted Content and Backlinks Published by AmpiFire
In a tech-saturated market dominated by giants like Amazon, small businesses face a challenge in gaining visibility and attracting customers.…

How to Increase Organic Traffic to Your E-commerce Website
Learn how to increase organic traffic to your e-commerce website with proven strategies, content tips, and optimization techniques. Boost your…