


Key Takeaways
- The website traffic metrics that matter come from Google and your own sales systems, because they record real people finding, contacting, and buying from you rather than outside estimates.
- Google Search Console’s clicks, Queries report, and Pages report show which search terms and pages bring traffic, so judge trends over three months or more.
- Sales by traffic source, inbound calls and emails, and As Seen On trust badges show whether visibility is becoming business, since many buyers call or email without clicking through.
- Domain Authority, individual backlink checks, daily rank tracking, and reverse-engineering Google are safe to ignore, because they are lagging estimates or daily noise that don’t predict traffic or sales.
- At AmpiFire, our amp campaigns publish content across 300+ sites that shows up in these reports, with one client growing site traffic 158% in six months.
Google Search Data vs. Third-Party Traffic Estimates
The metrics worth tracking measure real visitors and real revenue, while the ones to ignore are scores that look busy without changing what you publish next. Most search engine optimization (SEO) tools surface dozens of extra metrics, and many of them exist mainly to move you onto a bigger plan. Every hour spent grading backlinks or watching daily rank swings is an hour not spent publishing.
Where a number comes from determines how much weight it carries. Search Console reports clicks straight from Google and Shopify records which source sent each buyer, but third-party tools estimate from the outside, so their figures can lag by weeks or months. Reading both kinds of data the same way leads to wrong calls, like crediting a campaign too late or dropping one that is already working.
These reports only move when new content goes out. At AmpiFire, our amp campaigns publish content across news sites, podcasts, and video platforms, and the effect often shows up in Search Console as rising clicks and pages climbing the rankings.

How AmpiFire Works:
- Research & Target: Find high-demand topics your buyers search for.
- Create & Repurpose: AmpiFire’s AmpCast AI generates news articles, blog posts, interview podcasts, longer informational videos, reels/shorts, infographics, flipbooks/slideshows, and social posts.
- Distribute & Amplify: Auto-publish to 300+ sites, including Google News, YouTube, Spotify, and major news networks.
Get more traffic from people who want to buy your stuff, and powerful “As Seen On” trust badges for your site.
Do It Yourself (with AI), Done For You Content, & 100% Managed Organic Growth options available.
Grow Your Free Traffic From Everywhere
Website Metrics to Pay Attention to
1. Clicks
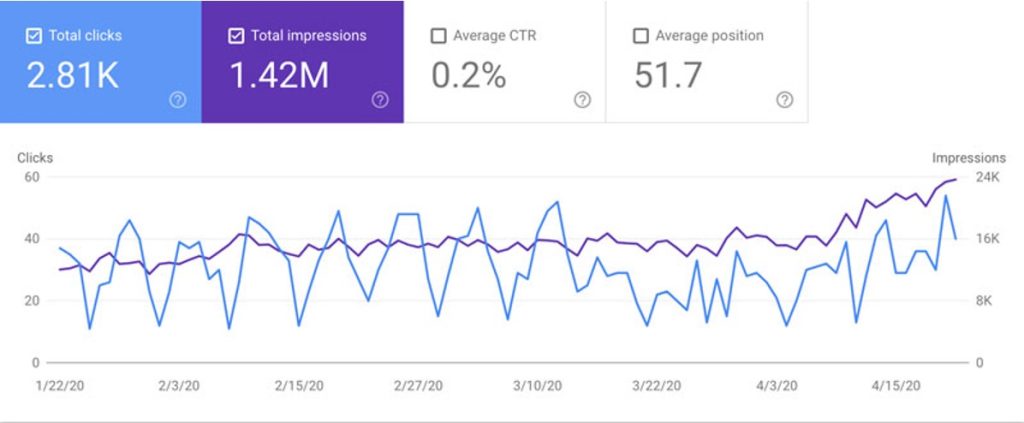
Clicks count the traffic reaching your site from search results, making them the clearest sign that your content is being found and chosen. Impressions count how often your listing appears in those results. Clicks usually follow impressions, but not always, so focus on a rising click count over time rather than day-to-day movement.
To track clicks, open the Performance report in Google Search Console and set the date range to the last three months or more. Clicks are the blue line, and impressions are the purple one, so a month where impressions climb while clicks stay flat points at your headline and description rather than your ranking.
2. Queries Report
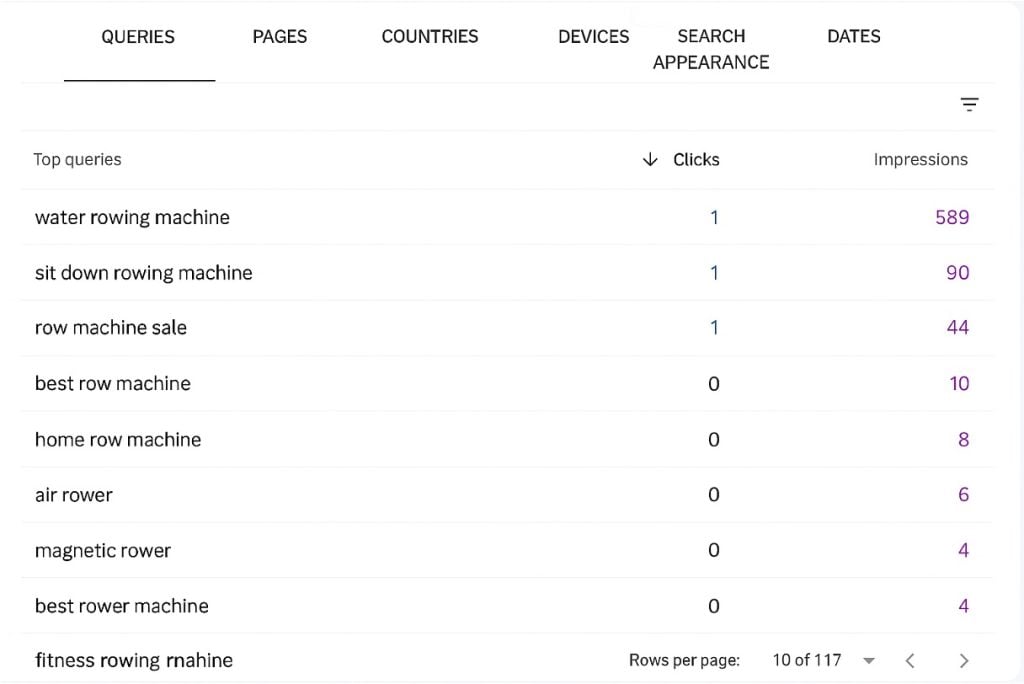
The Queries report is gold. It shows exactly which search terms drive traffic and impressions, giving you direct insight into which topics have the most demand.
- Look for new keywords you are ranking for that you did not target directly, as this shows demand and can be an opportunity for new content.
- Look at which pages get the most clicks, as this shows demand for that topic.
- Identify successful topics to create follow-up campaigns around. These will be topics you have done already that are generating lots of impressions and clicks, because that shows clear demand for the topic. Just avoid covering the same topic twice, and find a new angle that appeals to the same audience.
Note: Search Console will only show demand and clicks for topics you’ve already covered, or similar ones, because Google is showing your content. So you still need to find new topics to cover that have good buyer demand and manageable competition.
3. Pages Report
The Pages report shows which pages on your website get the most search traffic. Often, you will see pages rank higher after amp campaigns build your authority, which is where off-site work becomes visible on your own domain.
Step-by-Step Search Console Check
- Log into Google Search Console.
- Click “Performance” in the left sidebar.
- Set the date range to the last 3 months or more and look for a trend in traffic increases.
- Click the “Queries” tab to see what you are ranking for and identify new content opportunities.
Setting Up & Reading the Reports
Setting up Search Console starts with adding the site as a property and verifying ownership through a DNS record, an HTML file, or an existing Analytics or Tag Manager setup.
Search Console starts collecting data as soon as the property is added, even before verification is finished, so add the site before campaigns start to capture a clean baseline. Google’s setup guide walks through each verification method.
The Performance report shows clicks, impressions, average click-through rate, and average position. You can switch each on or off above the chart, and the table below breaks the data down by query, page, country, device, and date. Google’s Performance report guide covers the filters and comparison views in full.
What Good Results Look Like
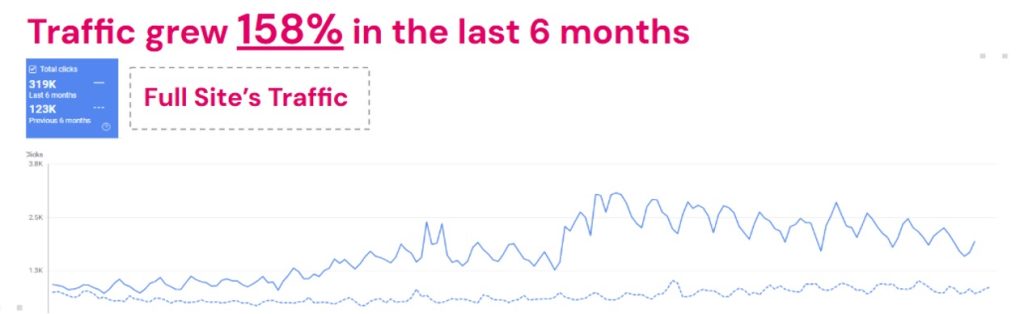
One AmpiFire client grew full site traffic by 158% in six months, combining Amps with a blog built on AmpCast AI content and optimized around AmpiFire’s buyer journey content strategy. The climb shows up in Search Console as a steady rise rather than a single spike.
4. “As Seen On” Opportunities
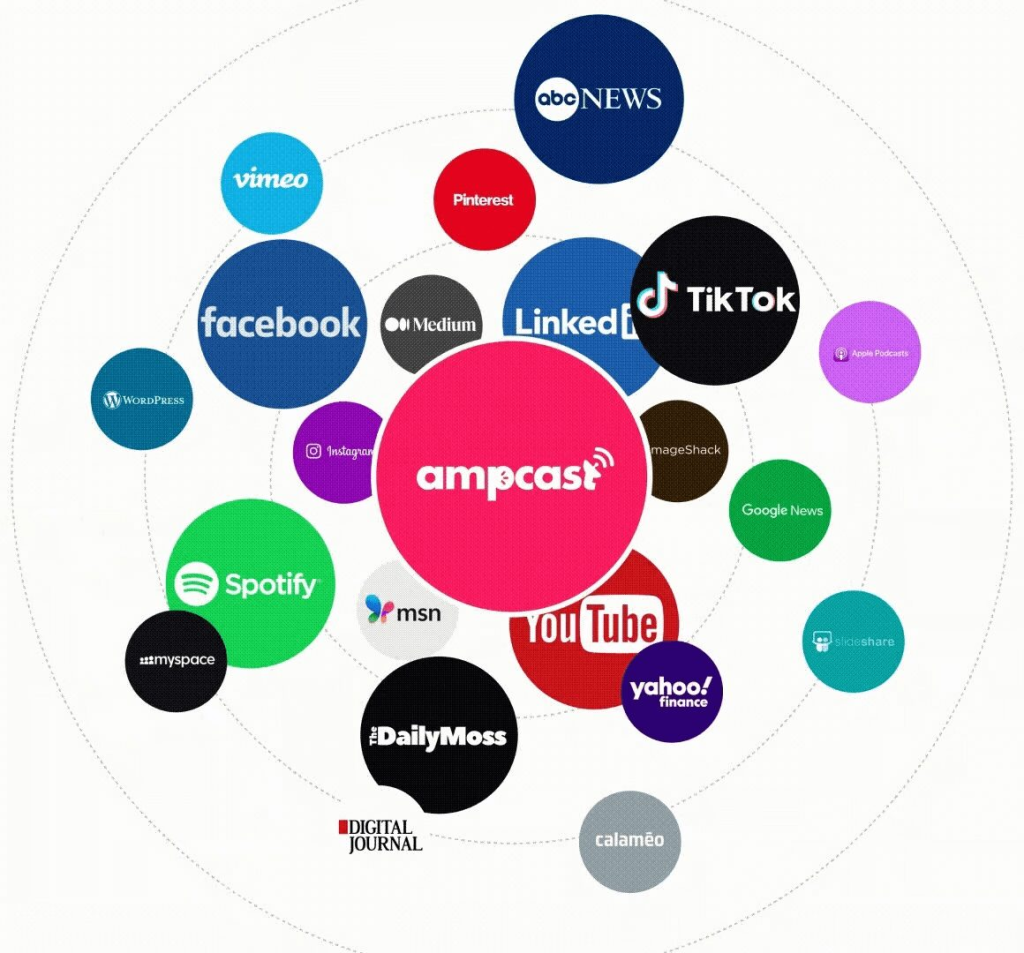
As amps get you featured on big brands, you are able to use “As Seen On” badges on your own site and pages. AmpiFire also has a badge tool embedded in the platform to make it even easier.

Being featured on recognizable brands is a great result because it builds trust immediately with your target audience and potential partners. You can then use that social proof to increase conversions.
- Monitor the sites you have been featured on through your distribution report or Semrush and Ahrefs, and look for recognizable brands you can highlight.
- Save screenshots of your content on major news sites.
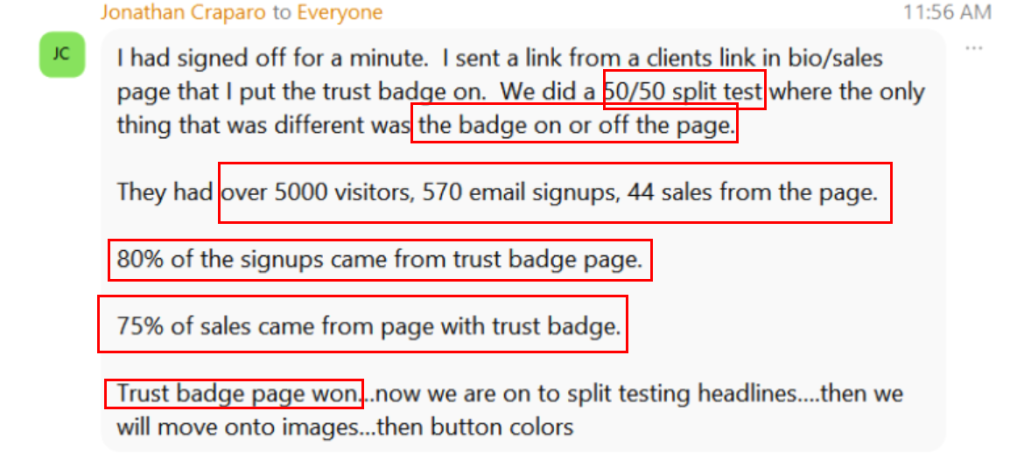
- Track conversion rate increases, optionally with A/B testing, since trust badges can boost conversions by 400% or more.
What Good Results Look Like
In a split test, the page carrying trust badges beat the page without them by roughly 300% more signups and 200% more sales. The badges changed nothing else on the page, so the comparison is clear.
5. Semrush or Ahrefs (3rd Party Analytics Tools)
If you don’t have access to the site you are promoting in Google Analytics or Google Search Console, you can use either tool to track increases in a site’s search traffic & backlinks over time.
- Create an account with either Semrush (which has a free tier) or Ahrefs (paid).
- Use the tools to track increases in organic traffic and ranking keywords as you publish more amps, or as more content goes out on the site and its social profiles.
- Focus only on the Overview page in Ahrefs and the Dashboard page in Semrush, and on metrics like organic traffic, pages, and the keywords the site is appearing for. This shows the content’s overall impact.
- Both tools will try to get you to focus on lots of other metrics that do not have much impact, and those extra metrics are mainly designed to get you to pay more for the service.
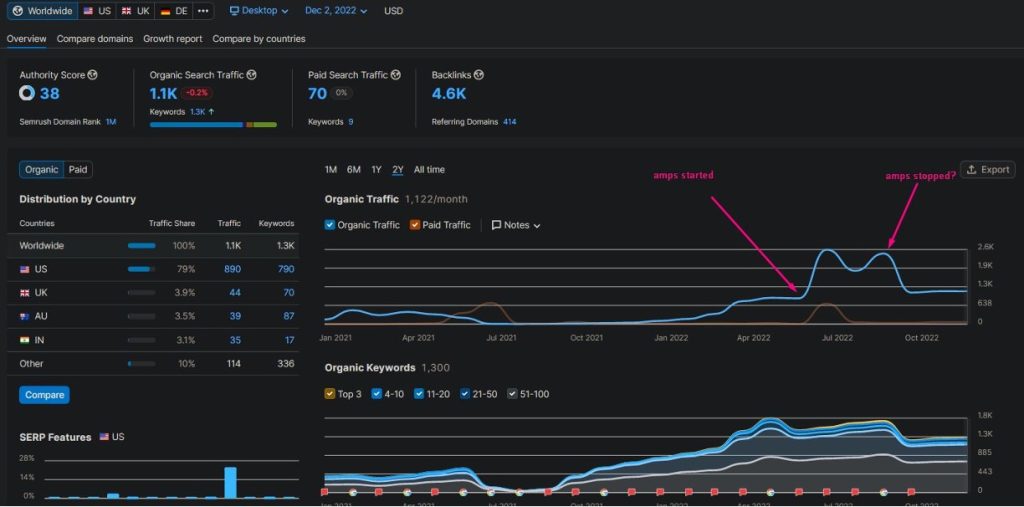
Note: Amps will often show a jump in backlink domains when started, which is followed by traffic increases. The timing may be off, since these platforms are rough estimates and take time to update.
The Ahrefs overview and the Semrush dashboard both open on a summary screen covering organic traffic, keywords, and referring domains. Reading either one means checking the direction of those three numbers month over month.
What Good Results Look Like (And What Happens When You Stop)
This ecommerce store ran 12 amps and then stopped. Organic traffic climbed through the campaign run and fell away once publishing ended, and we can confirm that trend against the site’s actual Search Console data.
6. Online Business Activity
One obvious way to see your results is to monitor increased business activity. This is something you are likely already doing, and if not, you should be.
Sales
If you sell products or services online, you can track sales by traffic source in Shopify, Google Analytics, and other ecommerce platforms.
- How to track sales by source in Shopify
- Google Analytics ecommerce tracking guide
- WooCommerce sales tracking setup
You can track and attribute increases in organic, search, and referral traffic to your amp campaigns. As your visibility grows and you answer more customer research questions, you should see a corresponding increase in sales from these traffic sources.
Track Calls, Emails, & Feedback
More visibility means more people are interested in what you offer and what you do, so you should see more people trying to get in touch with you directly. Here is how to track this:
- Call Tracking: Use call tracking software, or simply note the volume of inbound calls in your CRM, and compare month over month as campaigns go live.
- Email Inquiries: Track the number of contact form submissions or direct emails coming from your website.
- Qualitative Feedback: Ask new customers how they heard about you, as many will say they found your content during their research.
What This Tells You: Not all customer journeys result in a website click-through. Many people will:
- Read your amp content, get their questions answered, and then call you directly.
- Find you through content on news sites, social platforms, or your blog, and then email for more information.
- See your content several times across different platforms, and then reach out when they are ready to buy.
An increase in direct contact alongside your amp campaigns strongly signals that your visibility is converting into real business interest, even if attribution isn’t perfectly tracked in analytics.
How NOT to Track Results
The trap: obsessing over SEO metrics that do not correlate with actual business growth. If you regularly do any of the following, you are likely wasting time you could spend publishing more campaigns or closing more clients.
What NOT to Track (Or At Least Not Obsessively)
Domain Authority, Trust Flow, & Similar Metrics
- These are third-party estimates, not Google’s actual algorithm.
- They can be weeks or months out of date.
- A Domain Authority increase does not guarantee traffic or sales increases.
- Checking these daily or even weekly is pointless.
Individual Backlink Analysis
- Obsessing over whether each link is nofollow or dofollow.
- Analyzing the quality of every single backlink placement.
- Third-party backlink tools are inherently inaccurate and incomplete.
Daily Ranking Fluctuations
- Rankings naturally fluctuate day to day.
- Checking 50 or more keywords every single day creates anxiety without actionable insights.
- One keyword’s position is less important than overall visibility trends.
Trying to Reverse Engineer Google
- Spending hours debating what obscure algorithm signals mean.
- The algorithm is part AI, part human genius, and constantly evolving.
- You cannot outsmart it through analysis, only through consistent quality content.
The Reality
While you are spending 3 hours analyzing backlink profiles, someone else just published another campaign. While you are checking if a link is nofollow, someone else just closed another client. They are making money. You are measuring vanity metrics.
What Actually Matters
At the end of the day, only one question matters: did your efforts generate real traffic, rankings, and sales? Everything else is noise.
Do not misunderstand this. Metrics are important, but measure what drives business outcomes, which is traffic, rankings for buyer-intent topics, leads, and sales- and leave the vanity metrics that make you feel busy without moving the needle.
Track the Metrics That Matter While AmpiFire Grows Your Traffic
The metrics that matter are search clicks, the queries and pages behind them, and the sales, calls, and emails that follow. Domain Authority, backlink grading, and daily ranking swings are safe to ignore, because they don’t change what you publish next. Reports only reflect content that already went out, so the time saved is better spent publishing.
Those reports keep climbing only while you publish new content, and traffic can fall away once you stop publishing. With AmpiFire, we research the topics that buyers are actually searching for, produce the content in 8 unique formats (e.g., news articles, blog posts, interview podcasts, longer informational videos, reels/shorts, infographics, flipbooks/slideshows, and social posts), and distribute it across 300+ sites (e.g., Spotify, YouTube, Google News), so your Search Console reports have something new to show each month. Get started with AmpiFire to put more content behind the metrics you track.
Frequently Asked Questions (FAQs)
Why do Search Console clicks and Google Analytics sessions never match?
They measure different events. Search Console counts clicks on your search listing, while Google Analytics counts sessions that load its tracking script, so a permanent gap sits between them. The totals never agree, but both trends should move in the same direction.
How long before new content shows up in these reports?
Search Console data lags by a day or two, so a page can be indexed before it appears in the Performance report. Meaningful click volume usually takes several weeks to a few months, so judge new content over a 90-day window.
Does bounce rate matter for content pages?
Less than it used to. In GA4, bounce rate is the inverse of engagement rate, and any session lasting longer than ten seconds counts as engaged, so a visitor who reads a guide and leaves is not a bounce. It matters more on pricing pages.
What counts as good organic traffic growth?
No universal figure exists, because growth depends on your starting point, your competition, and how much you publish. Steady month-over-month gains across six months carry more information than a single spike, and a site publishing consistently should show clicks trending upward.
How does AmpiFire improve the metrics that matter?
At AmpiFire, our AmpCast AI platform turns one topic into 8 content formats and automatically publishes them across 300+ high-authority sites, which raises the clicks and sales your reports record.
*Disclaimer: Results may vary based on individual circumstances, business type, and content strategy. The time savings and outcomes mentioned are based on typical user experiences and are not guaranteed. For specific pricing and service details, please visit AmpiFire.
Author
Related Posts


How to Increase Organic Traffic to Your E-commerce Website
Learn how to increase organic traffic to your e-commerce website with proven strategies, content tips, and optimization techniques. Boost your…

How To Optimize Your Headlines To Boost Your Search Engine Rankings, Brand Visibility & Website Traffic?
Headlines are important because they help people to find your content. Since headlines appear on search engine results pages, they’re…

Rocketeer Features & Pricing: Can This “Ads Made Easy” Software Drive Instant Traffic to Any Website?
Explore Rocketeer's features and pricing to see if this "ads made easy" software can drive instant traffic to your website…

Amp Competitor Comparison Tool [Free]: Brand Mentions, Traffic, Backlinks & Pages
Enter your website and up to 9 competitor domains to instantly compare organic traffic performance and understand why certain sites…
Does Google Ignore Toxic Backlinks? Bad Link Removal & SEO Impact
Discover why you shouldn't fear toxic backlinks and how obsessing over their SEO impact may do more harm than good.


How to Measure Content Amplification Strategy & Key Metrics to Track
Learn how to measure content amplification across 300+ platforms. Track the key metrics that drive organic traffic, prove business ROI,…