

Key Takeaways
- AmpCast AI campaigns build visibility gradually, so judge them by a steady upward trend across 3–6 months, since weekly movement in one metric says little about progress.
- The Analytics tab in your AmpiFire members area shows traffic, Google impressions and clicks, AI mentions, and social engagement once you connect your social accounts, Google Analytics, and Search Console.
- Each published Amp has a distribution report, available by email or the Report button, that lists every site carrying the content and its page-one Google keywords at that moment.
- Your welcome page tracks Amp Rate, Brand Mentions, Brand Momentum, and Amp Search Appearance, and seeing all four rise over time points to growing organic traffic and sales.
- On Completely Managed plans, the AmpiFire team reviews your distribution reports and dashboard trends to choose your next topics and adjust campaigns when growth flattens.
Why AmpCast AI Results Are Measured by Visibility
Tracking AmpCast AI results comes down to measuring how visible your business has become, because most of the customers your campaigns bring in never leave a click trail that leads back to a single Amp. A buyer might read your content and then phone you, search for your brand name a few days later, or walk into your store weeks afterward, and none of those visits appear as a referral in any report.
The most common mistake is expecting a direct line from each Amp to a sale and deciding the campaigns have failed when that line never shows up. Content keeps attracting readers long after it goes live, so its value builds slowly. Reviewing your reports over several months shows whether your visibility is growing in a way that eventually brings more traffic and sales.

How AmpiFire Works:
- Research & Target: Find high-demand topics your buyers search for.
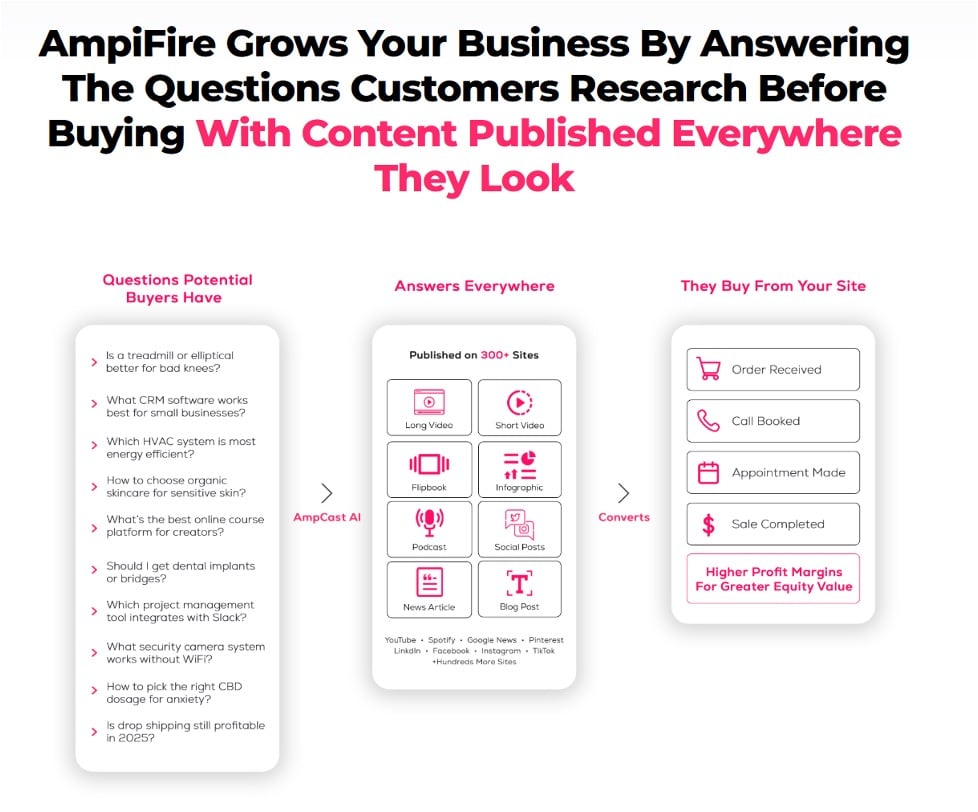
- Create & Repurpose: AmpiFire’s AmpCast AI generates news articles, blog posts, interview podcasts, longer informational videos, reels/shorts, infographics, flipbooks/slideshows, and social posts.
- Distribute & Amplify: Auto-publish to 300+ sites, including Google News, YouTube, Spotify, and major news networks.
Get more traffic from people who want to buy your stuff, and powerful “As Seen On” trust badges for your site.
Do It Yourself (with AI), Done For You Content, & 100% Managed Organic Growth options available.
Grow Your Free Traffic From Everywhere
Tracking Your AmpCast Results
Our AmpCast AI campaigns are an incredibly powerful tool for improving your brand’s overall visibility and presence. This means that as soon as you start running campaigns, any new customers you get can be a direct result of the campaigns, because increasing your online visibility with helpful content draws in more traffic from all sources.
Consider these real-world scenarios:
- A person sees content about your business on social media, then looks up reviews and finds AmpCast AI content about you, which directs them to purchase on your site.
- A person researching your business/product/service reads your AmpCast AI content but calls you directly instead of clicking through to your site.
- A person researching online finds one of your website pages on page one (where it wasn’t before you started running campaigns), clicks through to your site, and buys from you.
- A previous customer sees your AmpCast AI content shared on social media, remembers they need your service, and walks into your business two weeks later.
In all of these scenarios, the business got a new customer because of their AmpCast AI campaigns and growing multi-format content presence. However, as you can probably tell, tracking exact attribution is incredibly hard.
That’s why we focus on overall visibility. In pretty much every scenario, if you improve visibility the right way, by answering your customers’ questions at each stage of their buyer journey with great, helpful content, your business gets more traffic, more sales, and grows.
Your results live in three places in your AmpiFire members area: the Analytics dashboard, the distribution report for each Amp, and the welcome page.
How to Read the Analytics Dashboard
In the top bar of your AmpiFire members area, you will find the ‘Analytics’ tab. Click this to view your metrics dashboard.
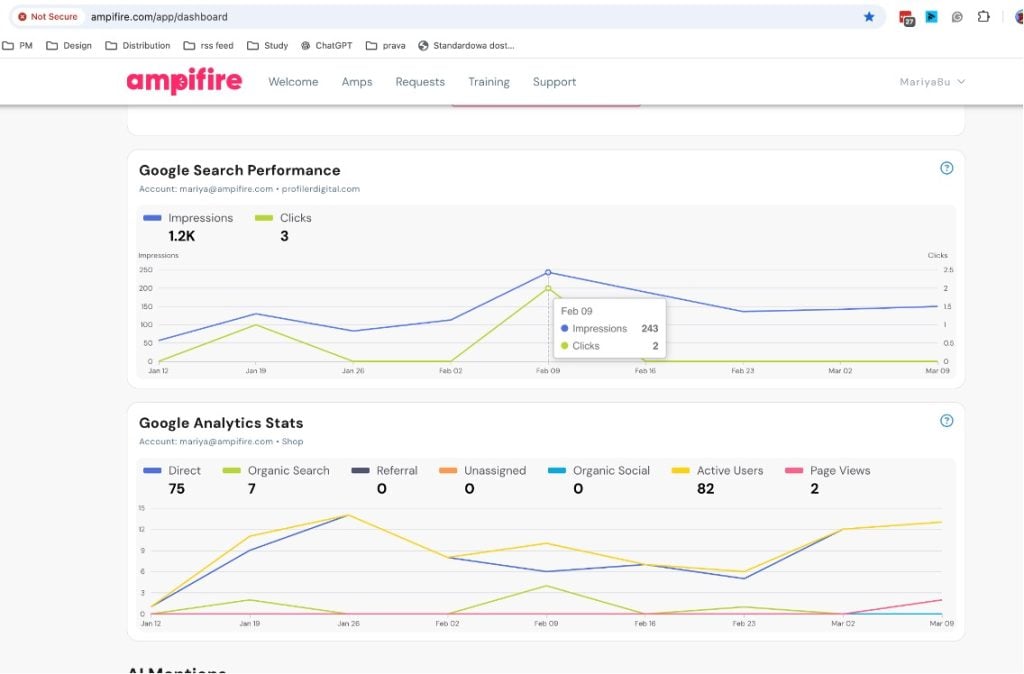
If you have connected your own social accounts, Google Analytics, and Search Console, you can track that data here. You can also view traffic, impressions, and clicks from Google, AI mentions, social engagement, and views, plus the performance of your recent Amps.
Use the dashboard to look for consistent upward trends over longer periods (think 3–6 months, not weeks). This helps you monitor whether your content strategy is moving in the right direction, without getting bogged down in numbers and metrics that don’t move the needle for your business. And of course, if the trend is not increasing over time, then it allows you to see that too and get help from our content experts to fix things.
How to Read the Distribution Report
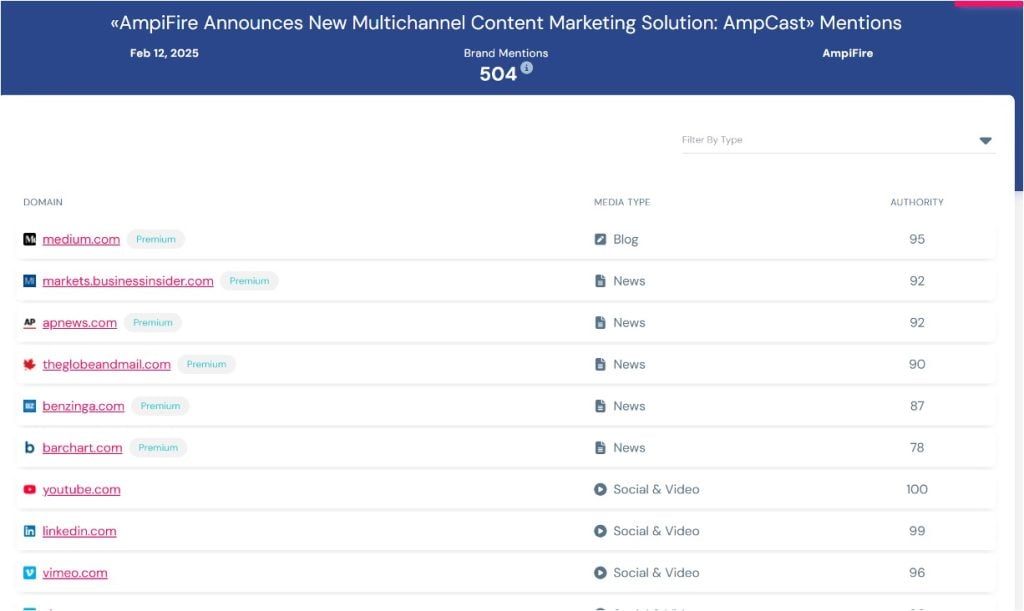
Every published Amp comes with a distribution report. It lists each site that published your content and the keywords your content appeared for on page one of Google when the report was created.
Once your Amp content is live, you’ll receive an email with a link to the report. You can also open it with the Report button inside your published Amp campaign:

The report links to every placement, from sites like Medium and AP News to platforms like YouTube and LinkedIn. It also lists the keyword variations your content now appears for on page one of Google. Some of these keywords will rarely be searched, but the list still shows which topics are gaining ground, which helps you choose what to publish next.
How to Read the Welcome Page
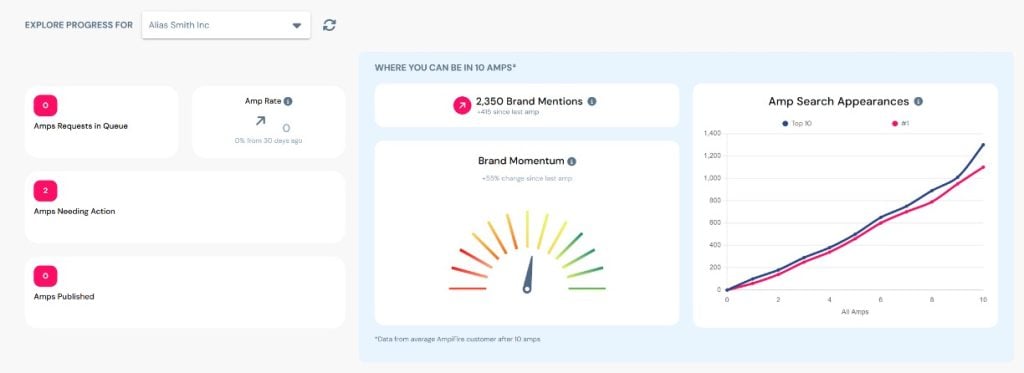
The welcome page is your Progress Dashboard, where you can track your metrics as you publish Amps. It gives you an overview of 4 key metrics that show your progress:
- Amp Rate – Rate of recent Amp publications per month
- Brand Mentions – Total content placements achieved through AmpiFire
- Brand Momentum – AmpiFire’s formula for calculating recent changes in your appearances and rankings relative to your amp publication rate
- Amp Search Appearance – Total number of Google search ranking results for content published through AmpiFire
When all 4 metrics rise over time, it’s a strong sign your content is bringing in more organic traffic and sales.
Keep Your AmpCast AI Metrics Rising with AmpiFire
The most reliable way to track campaign results is to review your dashboard, distribution reports, and welcome page together, and judge them by the direction they move over several months. Those reports can only measure content you have already published, so the trend keeps climbing only when new campaigns keep feeding it.
On Completely Managed plans, the AmpiFire team keeps that output steady for you. They research topics from your placement and keyword data, then build and publish each campaign on schedule, so you don’t need an in-house content team to keep up. Start your campaigns with AmpCast AI by AmpiFire, then check your dashboard again in three months to see the trend it has built.
Frequently Asked Questions (FAQs)
How many Amps do I need to publish before the metrics move?
Publishing volume sets the pace. Many businesses start with weekly campaigns. A local business in a low-competition market may see movement from one campaign a month, while a competitive ecommerce niche may need to publish daily. Each new campaign adds to the content already published, so results tend to build over time.
Do the results in a distribution report change after it is generated?
The report is a snapshot taken when it was created. Your content stays published, so Google can pick up more placements later, and your positions in search results can move up or down. You’ll see that ongoing movement in your dashboard and welcome page rather than in the original report.
How do I track customers who call instead of clicking a link?
Ask new callers where they first heard about you and log the answers. Watch branded search volume in Search Console alongside call volume. Phone inquiries rising in the same months as your visibility metrics is the usable signal, since no click path exists to record.
Can I compare AmpCast AI results directly against my paid advertising numbers?
Not on the same timeline. Paid traffic stops when spending stops, so it reports cleanly month by month. Organic content keeps bringing in traffic long after it’s published, so its value builds over time. Compare the cost of each new customer across a year rather than week to week.
The two also work best together. When people who see your ads go on to research you, they find your articles, videos, and podcasts, which builds the trust that turns ad clicks into sales.
How does AmpiFire decide what to publish next based on my reports?
On Completely Managed plans, the AmpiFire team checks your placement and keyword data against three filters: verified demand, manageable competition, and buyer intent. Topics that meet all three become your next campaign, so each new Amp targets searches your buyers are already making.
*Disclaimer: Results may vary based on individual circumstances, business type, and content strategy. The time savings and outcomes mentioned are based on typical user experiences and are not guaranteed. For specific pricing and service details, please visit AmpiFire.
Author
Related Posts


Tracking AmpCast Results for Local Businesses
See how to track AmpCast results for a local business with a snapshot report, Business Profile visibility, call tracking, and…


How to Repurpose YouTube Videos for Instagram: Step-by-Step Guide & Tools
Learn how to repurpose YouTube videos for Instagram Reels using a simple editing workflow, top tools, and automation, then read…


How to Turn a YouTube Video Into a Blog Post: Step-by-Step Guide
Learn how to turn a YouTube video into a blog post with our step-by-step guide. Discover easy tips to repurpose…

AIclicks Pricing & Reviews: Is This AI Search Visibility Tracking & Optimization Tool Worth It?
Compare AIclicks pricing across Starter, Pro, and Business plans, check real G2 reviews, and learn whether this AI visibility tracker…


How to Turn Article into Video: Step-by-Step Guide & Tips
Learn how to turn articles into videos step-by-step. Compare AI tools vs manual methods for converting written content into engaging…


How to Use ChatGPT to Add Internal Links to Content, Blogs & Articles: Step-by-Step Guide
Streamline internal links in your content with ChatGPT's versatile roles, from Idea Generator to SEO Metric Analyst and boost your…