
Key Takeaways
- Site-wide traffic misses local AmpCast results, so tracking happens at the service-and-location level through snapshot rankings, Google Business Profile visibility, calls, and walk-ins.
- A snapshot report maps key services against nearby towns of 10,000 to 150,000 people, scoring each square red to green for visibility and 1 to 5 dots for competition.
- Setup takes 1 to 2 hours before the first campaign, and monthly updates take about 30 minutes by duplicating the last tab and rerunning the same searches.
- Google retired Business Profile call history in July 2024, so calls need a CallRail or Nimbata tracking number, while walk-ins are tracked mainly by asking customers.
- AmpiFire’s AmpCast AI aims each campaign at one service-and-location square, an approach that took a Dallas roofer from nearly all-red to visible for every service in one year.
Why Site-Wide Traffic Misses Local AmpCast AI Results
Tracking AmpCast AI results for a local business means measuring visibility for each service in each area where customers search, not watching overall site traffic. Site-wide numbers can climb while the services that bring in revenue stay invisible nearby. They can also stay flat while a dentist starts showing up for implants in three neighboring towns.
The costliest mistake is waiting until campaigns are already live to start measuring. Without a recorded starting point, page-one gains, extra calls, and new walk-ins can’t be tied back to the campaigns behind them, so owners and agencies end up guessing which services and areas to target next.
AmpiFire built the snapshot report to solve this, giving local businesses a service-by-location map of where they stand before the first AmpCast AI campaign publishes and a clear record of every square that moves after.

How AmpiFire Works:
- Research & Target: Find high-demand topics your buyers search for.
- Create & Repurpose: AmpiFire’s AmpCast AI generates news articles, blog posts, interview podcasts, longer informational videos, reels/shorts, infographics, flipbooks/slideshows, and social posts.
- Distribute & Amplify: Auto-publish to 300+ sites, including Google News, YouTube, Spotify, and major news networks.
Get more traffic from people who want to buy your stuff, and powerful “As Seen On” trust badges for your site.
Do It Yourself (with AI), Done For You Content, & 100% Managed Organic Growth options available.
Grow Your Free Traffic From Everywhere
Local Businesses (Dentists, Accountants, etc.) Additional Results Tracking
If you’re promoting a local business (dentists, accountants, roofers, restaurants, etc. that serve a specific geographic area), there are additional ways to track your Amp campaign results and visibility improvements.
The Snapshot Report Strategy
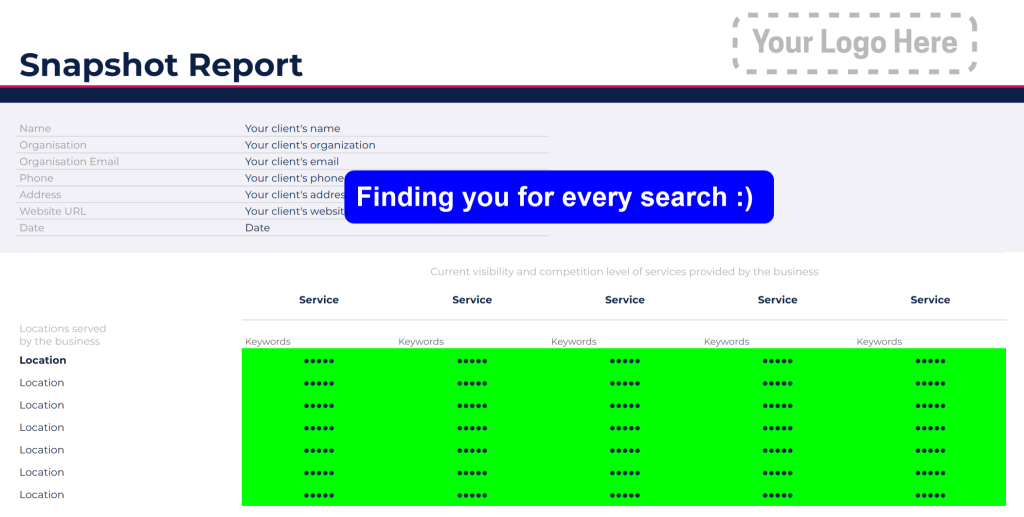
AmpiFire has developed a powerful resource specifically for local businesses called the ‘Snapshot Report’; it shows you a snapshot of your visibility for all your key services in the locations where your customers are searching.
This tool helps you:
- Identify opportunities to improve visibility and attract new customers
- Create a long-term content plan targeting local buyer research
- Track your visibility improvements month-over-month as you publish campaigns
If you run a local business or are using AmpCast AI to help a local business, it is highly recommended that you set up and maintain a snapshot report.
How to Set Up a Snapshot Report
A snapshot report takes roughly 1–2 hours to set up. Build it before the first campaign publishes, because a report started later cannot show how far the business has moved.
Each key service gets its own column and is chosen for profitability, demand, or growth potential. The buyer keywords customers use for that service are listed underneath it. Target locations go down the first column, starting with nearby neighborhoods and towns of around 10,000 to 150,000 people, where search demand exists but competition tends to be lower.
Each service and location square is then scored by searching Google for that combination. Each search notes both the level of competition and whether the business appears.
How to Read a Snapshot Report
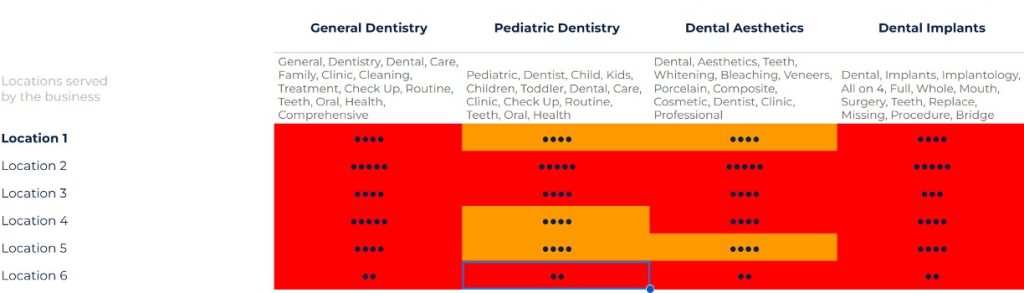
Each square gets a visibility color and a competition rating of 1–5 dots. The colors mean the following:
- Red: The business is nowhere on page one.
- Orange: The business appears for some longer, more specific keywords.
- Yellow: The business appears for several combinations or in the Google 3-pack.
- Green: The business ranks consistently near the top for most keywords.
One dot means no page-one sites target the keyword. Five dots mean the 3-pack businesses have 50+ reviews and high-profile sites appear even on page two.
Red or yellow squares with 1–2 dots for a high-demand service are the quickest wins, so they get the first campaigns. Squares with 4–5 dots need a longer, steady campaign strategy.
How to Update a Snapshot Report Each Month
Updates take around 30 minutes. After each month’s campaigns, duplicate the previous tab and run the same searches again.
Each square is then recolored based on whether the Amp content or the business’s website now ranks where it didn’t before. Keeping every month on its own tab makes before-and-after comparisons simple.
How the Snapshot Report Worked for a Dallas Roofing Company
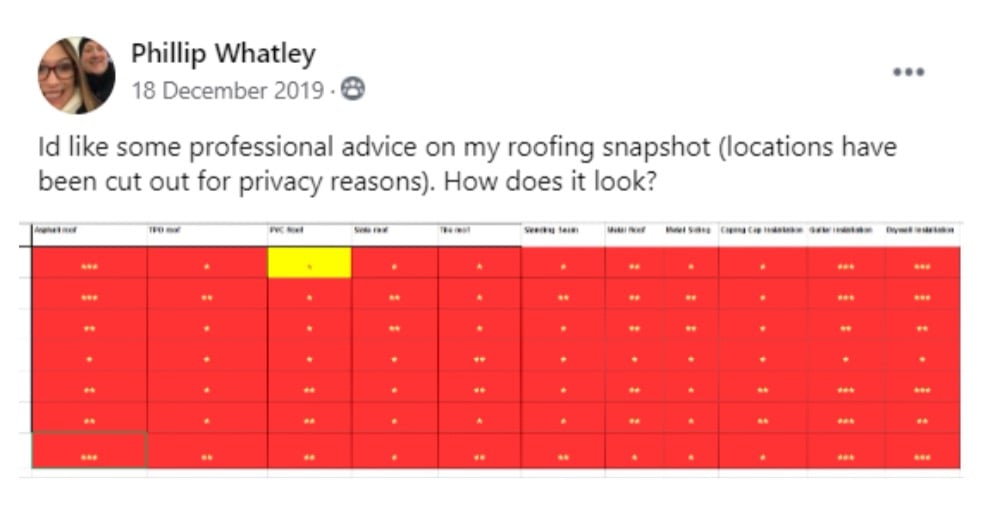
Phillip Whatley, an agency owner in the AmpiFire community, took on a Dallas-area roofing contractor that had no Google Business Profile. He created one before running any Amp campaigns. The opening snapshot report mapped the roofer’s services against the areas it serves, and nearly every square came back red.
Each Amp campaign targeted one of the roofer’s services in one of its service areas, so every square on the report had campaigns aimed at it over time. Within the first few months, squares began turning from red to green, and the contractor held two or three page-one positions through AmpiFire articles and other content formats.

Those rankings came for the keywords most important to the business, including searches in Ellis County. One year and 23 campaigns later, the updated report showed the business visible for all of its services across its areas.
Whatley put the before-and-after reports side by side to show the client exactly which services and areas had moved. The client then rebuilt the whole website, is now getting business from that visibility, and is continuing the campaigns to reach larger areas.
Step-by-Step Local Business Results Tracking
1. Google Business Profile (GBP) Visibility
If you don’t have a Google Business Profile yet, you should create one immediately. It allows your business to rank in local Google searches and Google Maps as you build your online presence.
What to Track:
- Your GBP appearing in more local searches as you build authority with Amp campaigns.
- Higher rankings in the “map pack” (the 3 local businesses shown in Google search results).
- Increased visibility for “[your service] near me” and “[your service] in [your city]” searches.
As your Amp campaigns answer more customer research questions and build your authority, Google recognizes your business as more relevant for local searches.
2. Set Up Your Snapshot Report
The snapshot report helps you track your business’s overall improved visibility by monitoring how your Amp content and website appear over time for the services you sell in the locations you service.
How It Works:
- Track rankings for key service + location combinations (e.g., “24/7 emergency plumber for flooding West Town Chicago,” “How much does a child’s tooth removal cost in Austin”)
- Monitor month-over-month improvements as campaigns build authority
- Identify which services/locations need more content coverage
Follow the Snapshot Report setup steps above.
3. Track Calls to Your Business
More visibility means more potential customers calling you directly after finding your content or business profile.
For organic search calls specifically:
- Track calls to the number on your Google Business Profile
- Google removed direct call tracking, but you can set up a tracking number for your GBP using services like CallRail or Nimbata
- See this guide for setting up GBP call tracking
Compare call volume month-over-month as you publish more campaigns to see the impact of your growing visibility.
4. Track Walk-ins to Your Business
For businesses with physical locations, increased visibility often leads to more foot traffic.
How to Measure This:
- Google can automatically measure foot traffic to your location if certain criteria are met: Learn about Google’s store visits tracking.
- Manually track walk-ins and ask customers, “How did you hear about us?” Many will mention finding your content during their research.
- Compare foot traffic patterns before and after starting Amp campaigns.
What Good Results Look Like
A green square means the business ranks consistently near the top for most keywords for that service in that location. The example is a business dominating its local space for all services, even at the highest five-dot competition level. Green is good!
Measure Local AmpCast AI Results From Day One With AmpiFire
Local AmpCast results only become clear when you measure them where customers actually search: by service and by location. Snapshot rankings show whether visibility is growing, while Business Profile visibility, calls, and walk-ins show whether it’s turning into customers. None of it proves much without a starting position recorded first.
At AmpiFire, we help local businesses build a snapshot report before their first AmpCast AI campaign goes live, then use each monthly update to target the red squares that matter most. Map your services and locations with AmpiFire and track your gains from the very first campaign.
Frequently Asked Questions (FAQs)
How often should you share a snapshot report with a client?
Once a month while campaigns are running, then once a quarter after the first six months. Each update works best when it opens with the color changes, shows the before-and-after reports side by side, and names the squares the next campaigns will target.
What are the most common snapshot report mistakes?
The most frequent errors are listing the same service twice under different names, choosing locations too small to have search demand or too large to compete in, adding sub-keywords that belong to a different service, and scoring competition without checking the dot criteria. Each one skews which squares get targeted first.
How long does it take to see local results from AmpCast AI campaigns?
Results vary, but squares can start changing within the first few months. In the Dallas roofing example, the business held two or three page-one positions within the first few months, and after one year and 23 campaigns, it was visible for all of its services across its areas.
Can a service-area business with no storefront track results the same way?
Yes. A service-area business can use the same snapshot report, Google Business Profile tracking, and call tracking. Because it hides its address on its Business Profile, Google’s store visit measurement does not apply, which makes calls the main conversion signal and a tracking number on the profile especially important.
How does AmpiFire produce the local results a snapshot report tracks?
AmpCast AI by AmpiFire turns one demand-verified buyer topic into 8 content formats: news articles, blog posts, interview podcasts, longer informational videos, reels/shorts, infographics, flipbooks/slideshows, and social posts. Our platform then automatically publishes them across 300+ sites, including YouTube, Spotify, Apple Podcasts, Pinterest, and Google News, with each campaign targeting one service and location square on the report.
Disclaimer: Results may vary based on individual circumstances, business type, and content strategy. The time savings and outcomes mentioned are based on typical user experiences and are not guaranteed. For specific pricing and service details, please visit AmpiFire.
Author
Related Posts


Advanced Web Ranking (AWR) Reviews, Pricing & Alternatives: Is This SEO Rank Tracking Tool Worth It?
Read Advanced Web Ranking reviews, learn pricing and top alternatives. See if this SEO rank tracking tool is worth your…
AIclicks Pricing & Reviews: Is This AI Search Visibility Tracking & Optimization Tool Worth It?
Compare AIclicks pricing across Starter, Pro, and Business plans, check real G2 reviews, and learn whether this AI visibility tracker…


Marketing Agency Services For Lawyers: Content Strategy Helps Law Firms Gain Local Keyword Domination
In this case study, you’ll learn how AmpiFire helps small and medium-sized businesses grow their online visibility and get more…

3 Main Types of Business Models: Pros and Cons of Ecommerce, Affiliate & Local Marketing
Are you interested in learning about different types of business models? Consider this breakdown on using ecommerce, affiliate, and local…

Make.com AmpCast Integration | RSS to Blog, Email & More
Make.com is a powerful automation platform that lets you connect an RSS feed to a huge number of apps and…

HubBox Reviews, Pricing & Features: How Does This Local Pickup App Work?
Learn about HubBox local pickup options, mobile-friendly maps, platform integrations, pricing plans, and reviews. AmpiFire helps grow your online store’s…